Stock-Pumping Swindle
In the nearby column Jim Quinn debunks Wall Street’s latest claim that the American consumer is bounding back. He points out that on an inflation-adjusted basis retail sales are barely higher than they were a year ago, and, for that matter, are still only 4% greater in real terms than they were way back in November 2007.
That’s right. Nearly eight years and $3.5 trillion of Fed money printing later, yet the vaunted American consumer is struggling to stay above the flat line, not shopping up a storm.
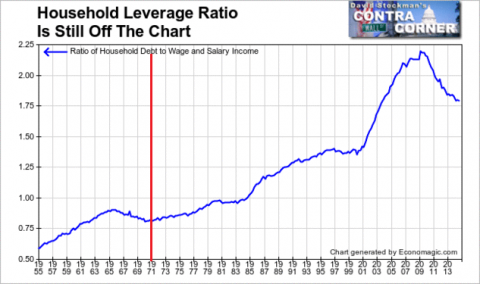
And there is no mystery as to why. After a 40-year borrowing spree culminating in the final mortgage credit blow-off on the eve of the great financial crisis, the US household sector had reached peak debt. It was tapped out with $13 trillion of mortgages, credit cards, auto, student and other loans —–a colossal financial burden that amounted to nearly 220% of wage and salary income or nearly triple the leverage ratio that had prevailed before 1971.
So, as is evident from the graph above, we are now in a completely different economic ball game than the consumer debt binge cycle that culminated in 2008. Households are deleveraging out of necessity, and that means that consumer spending is tethered to the tepid growth of national output and wage income.
Accordingly, there developed a massive tidal wave called “retail operating leases” that quenched this thirst for yield—helped along by accounting loopholes which allowed trillions of these operating leases to be kept off borrower balance sheets and which thrived on the illusion that the proliferating chains of new retail concepts served up by the Wall Street IPO machine were “national credit tenants”.
These overnight sensations were peddled on the basis of allegedly solid and sustainable “business models”, implying blue chip credit status. This meant, in turn, that retailers were afforded such attractive terms (10-15 years) and razor thin leasing spreads over benchmark rates that retail occupancy costs were dirt cheap relative to the true long-run economics and risks.
Suffice it to say that operating leases and national credit tenant financing by banks and institutional fixed income investors like insurance companies and pension funds account for virtually all of the stupendous gain of 10 billion square feet of retail space since 1990. And all of the cheap debt which funded this vast deformation will not be found on the balance sheet of any known retailer.
Thus, during the last 25 years when overall retail space was rising from 5 billion square feet to 15 billion square feet, the total number of shopping centers—–and especially cheap debt driven strip malls (under 100,000 square feet)—–and total footage has also soared. c
Needless to say, vacancy rates have steadily risen and mall rents have started to roll over. Yet the market for retail space doesn’t clear because the Fed’s drastic, sustained financial repression keeps cash flowing to faltering incumbents and dodgy new competitors alike.
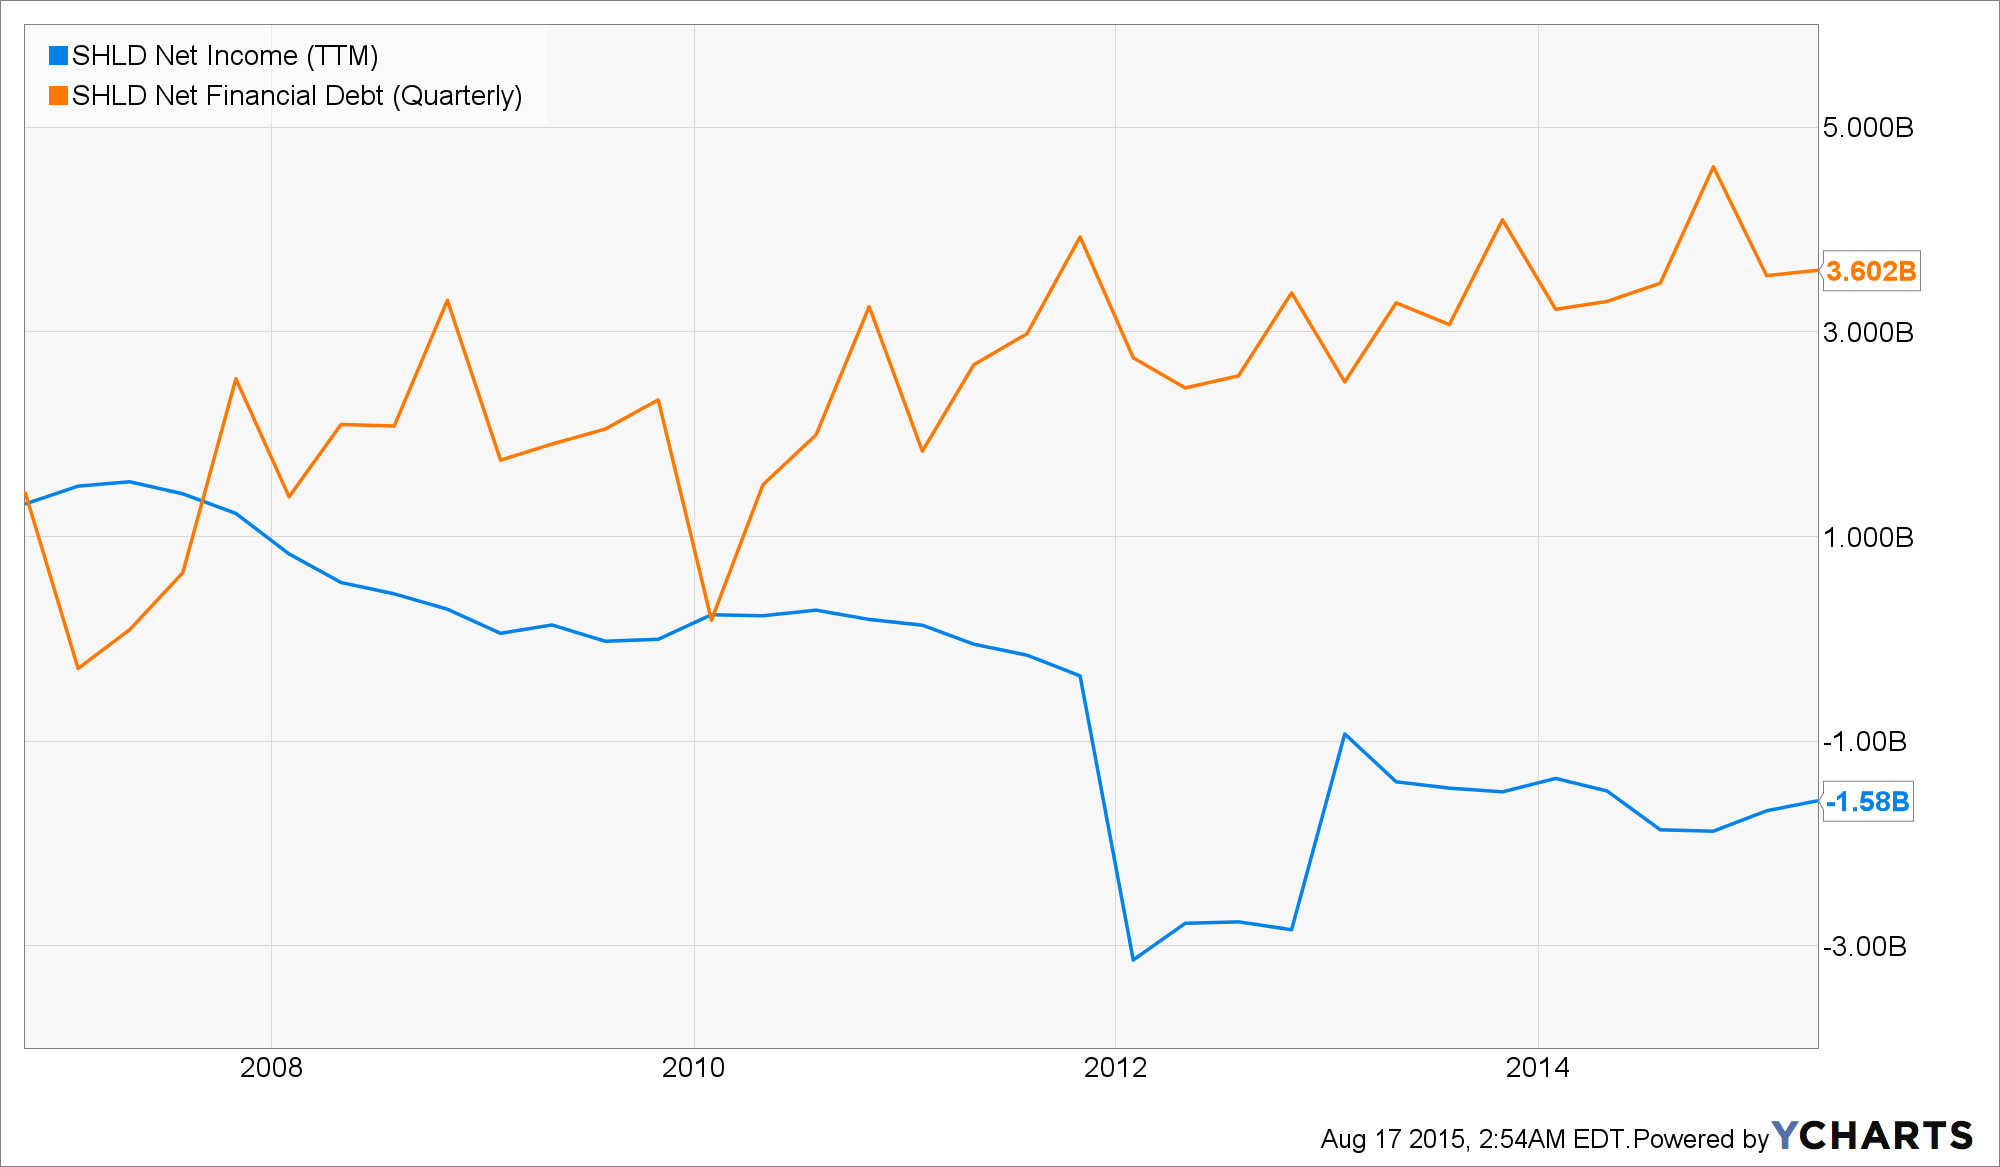
So the dance of the zombies goes on. Sears shows how it is done, but it’s only an advanced case.
In that episode, Eddie Lambert was the willing agent of its demise, but the casino momo games among the hedge funds which clambered onboard in the early days when massive amounts of cash were being sucked out of the company, and its ability to access cheap debt markets during the long years when the disaster was unfolding, were enabled by the mad money printers in the Eccles Building.
In short, last week’s tepid retail reports were not only a remainder that QE and ZIRP have by-passed main street entirely. The faltering department store sector is also a reminder that the monumental amount of Fed confected cash pooling-up in the canyons of Wall Street is breeding debt-laden zombies throughout the length and breadth of the land.
SHLD Net Income (TTM) data by YCharts
Reprinted with permission from David Stockman’s Contra Corner.


Leave a Reply