BREAKING BAD: COMEX EDITION
 COMEX silver bar inventories just completed an epic CLIFF-DIVE.
The SHATTERING Of The Comex is at hand:
From the SRSRocco Report:
The once mighty paper price setting Comex Exchange has now become a mere shadow of its former self. Before the U.S. Investment Banking and Housing Collapse in 2008, the Comex held over five million oz in its Registered Gold inventories. At the peak, it held approximately 5.3 million oz (Moz) in 2006:
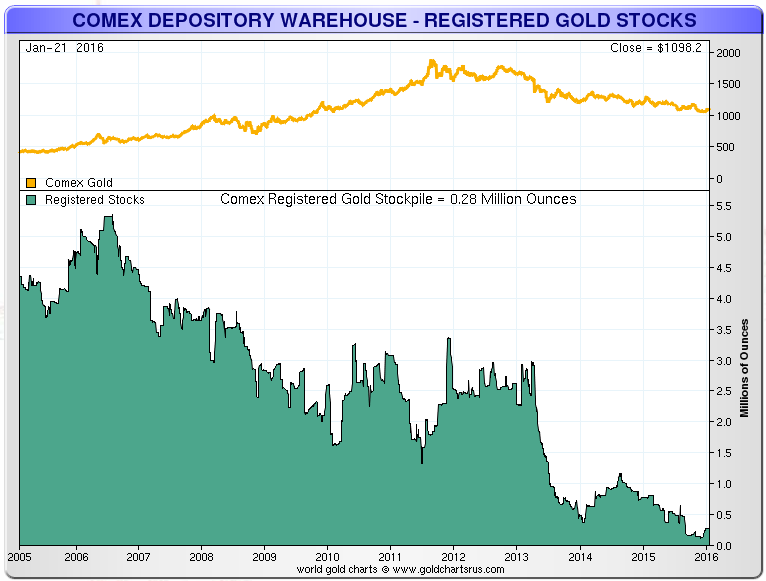
As we can see in the chart, the trend has been lower, with a cliff-like decline at the beginning of 2013. This was during the time when the gold price fell from $1,650 to $1,150 in just six months. Savvy traders who were trying to exit their gold positions by getting the best possible price, did so by knocking the price down by over $100 on many days. Nothing like exiting a trade strategically… CNBC style.
Regardless, the Registered Gold inventories fell from 5.3 Moz in 2006 to a lousy 275,000 oz today. We must remember, Registered Inventories are gold stocks that are ready to be delivered into the market. Some analysts may say this really isn’t that big of a deal because there is still 6.4 Moz worth of gold at the COMEX.
While this is true, I would imagine most of that 6+ Moz of Eligible Gold stocks are held in tight hands. And who knows of much of that 6.1 Moz of Eligible Gold stocks are actually there at the COMEX or how many claims on put on each ounce?
Here is another chart showing the decline of Registered Gold inventories at the Comex (courtesy of Sharelynx.com):
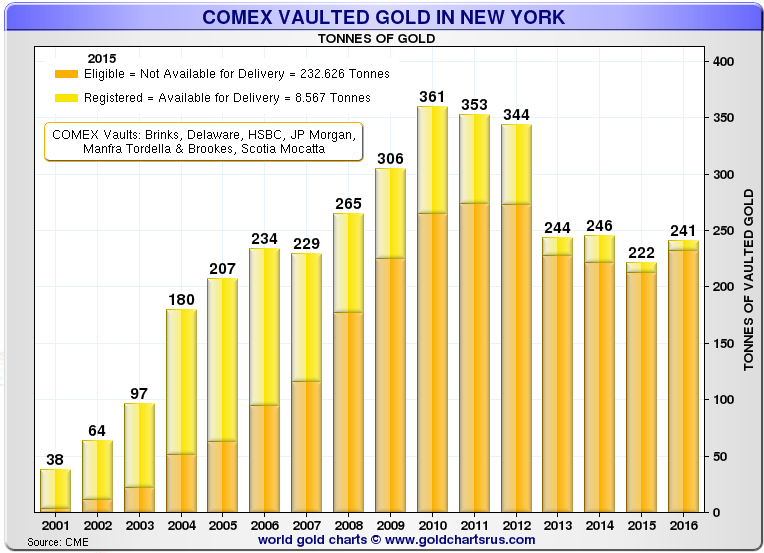
The light yellow bars (on top) are the Registered Gold inventories which the tan-colored bars (bottom) are the Eligible. In 2004 we can see just how large the yellow bar is compared to the tan bar. Thus, Registered Gold inventories were likely 75% of the total inventories in 2004. Today the Registered Gold inventories are shown as that little blemish of yellow on top of the Eligible tan bar which now only represents a lousy 4% of total inventories.
Comex Silver Inventories Decline Significantly Over Past 6 Months.
Not only have the Registered Gold inventories declined significantly, so have the total Comex Silver stocks over the past 6 months:
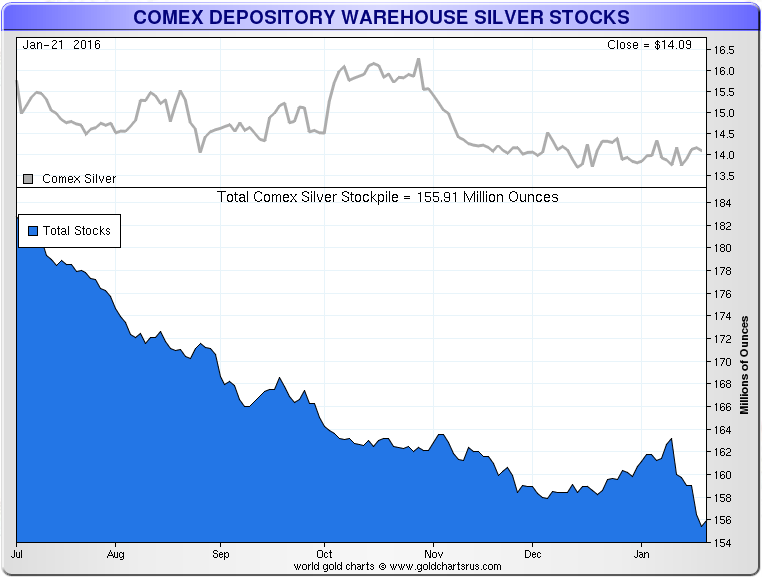
Total Comex Silver inventories fell from a peak of 184 Moz in July to 156 Moz presently. However, the majority of the declines came from the Registered inventories:
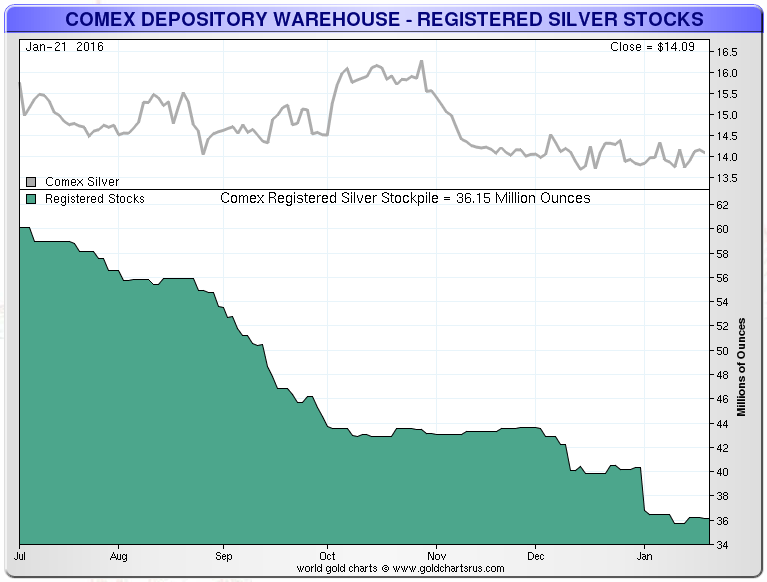
In a little more than six month, Registered Silver inventories declines from 60 Moz in July, to 36 Moz currently. Just as with gold, we are seeing a drain of Registered Silver inventories.
We can see this trend more clearly in this chart:
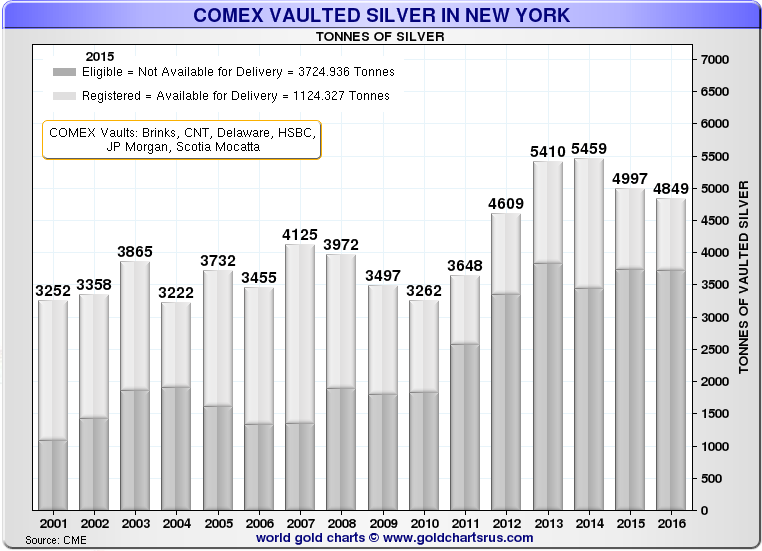
In 2007, there was more silver held in the Registered Category (top bar) than in the Eligible (bottom bar). I would assume Registered Silver inventories were about 70% of the total. Over the years it has trended lower. Today, Registered Silver inventories are only 23% of the total at the Comex.
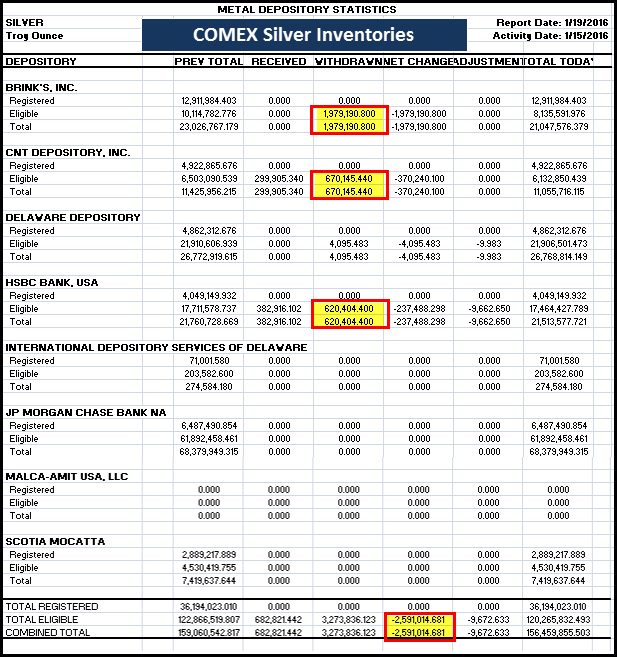
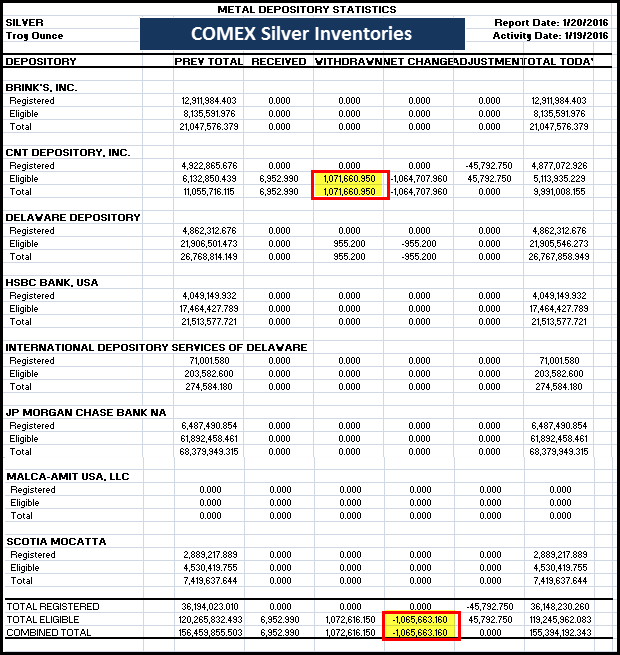
While it’s true that there is still 36 Moz of Registered Silver inventories, the trend (like gold) has been lower. Furthermore, we have seen some large movements of silver off the Comex in recent days. There was a large 3.2 Moz withdrawal on Jan 19th and another 1 Moz on Jan 20th:
Yesterday, there was a 600,000 oz deposit pushing the total back to 156 Moz. However, it is quite strange to see a continued draw-down of Comex Silver bar inventories at a time when industrial demand has declined while investment demand has moderated since its surge July-Sept 2015.
On the other hand, the Shanghai Futures Exchange Silver inventories continue to grow and are now 790 metric tons (mt), up from 600 mt at the beginning of the year. So, we the EAST experience an increase of silver inventories at one of its exchanges, while the Comex in the WEST continues to fall.
Many investors don’t trust the data coming from the Comex, and to some extent, I agree. However, there is some method to the madness at the Comex when they publicly disclose a collapse of Registered Gold inventories and continued large drain of silver.
If we look at this last chart, we can see an interesting trend:
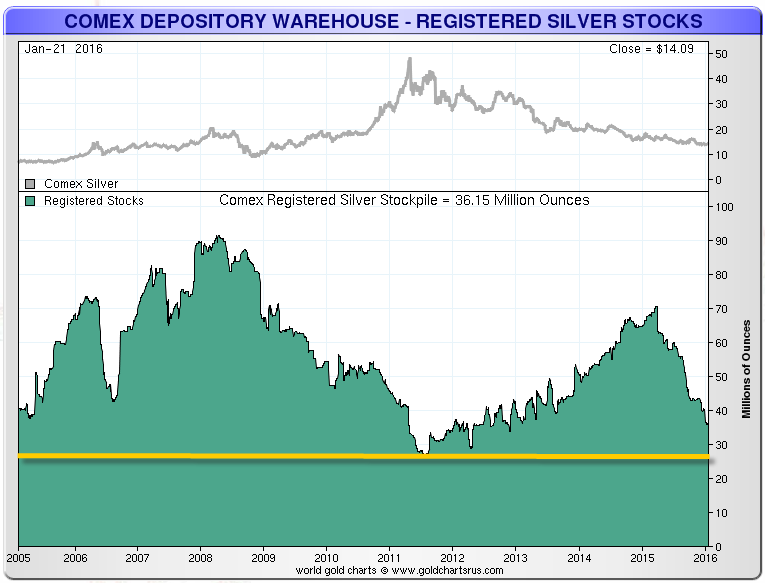
Registered Silver inventories bottomed (yellow line) in mid 2011. This is about the same time the price of silver peaked at $49. If we look at the chart on the top of the graph (silver price chart), we can see as the price of silver increased to $49, the level of Registered Silver inventories declined.
Now, over the following four years, Registered Silver inventories continued to increase to a peak of 184 Moz in July of 2015. However, something changed in 2015. As the price of silver continued to trend lower, Registered Inventories dropped significantly. This was during the huge spike of retail silver investment demand stemming from a possible Greek Exit and a forecasted collapse of the broader stock markets by the end of the year.
So, over the past six months, the Registered Silver inventories did not decline due to higher prices, but skyrocketed investment demand. Even though the markets recovered at the end of 2015, they started down in a bad way in 2016. Once this DEAD-CAT BOUNCE we are witnessing in the markets is over, I believe we will see the markets plunge once again.
This will likely push silver investment demand up much higher, thus resulting a continued decline in Comex Registered Silver inventories.
The Breaking Of The Comex Exchange is at hand.
I am not saying there will be a default (could happen though), but rather it seems as if the Comex will no longer be the price setting mechanism as it has been in the past.
Leave a Reply