Why You Should Care About the Baltic Dry Index
For the 1st time in years, everything is in place for a major bullmarket phase to get underway in gold and silver. There are two big reasons for this. One is that the dollar is looking set to drop – and has started to already. The other reason, which is of course related, is that those in power look set to attempt to loosen the intensifying deflationary stranglehold on the world economy by unleashing a global QE blitz that could dwarf anything that has come before, and will end in hyperinflation. Egon Von Greyerz talks about this in an article on King World News entitled Legend Warns Global Panic Is Coming. Don’t be put off by the lurid, blood-curdling presentation – I believe that what Von Greyerz writes makes perfect sense, and his gold bullion service outside of the banking system sounds like an attractive option – remember that “What’s yours is theirs”, so if it is inside the banking system they will simply appropriate (steal) it, if it suits them, when the time is right. Note that I have no association with Von Greyerz or KWN and no incentive for mentioning all this.
Now I want to point out that everything has unfolded pretty much exactly as set out in the article Imminent Dollar Shock and Effect on Gold, Silver & Oil that was posted on www.clivemaund.com on 18th January. This was a subscriber only article and some subscribers did very well after buying things like NUGT.
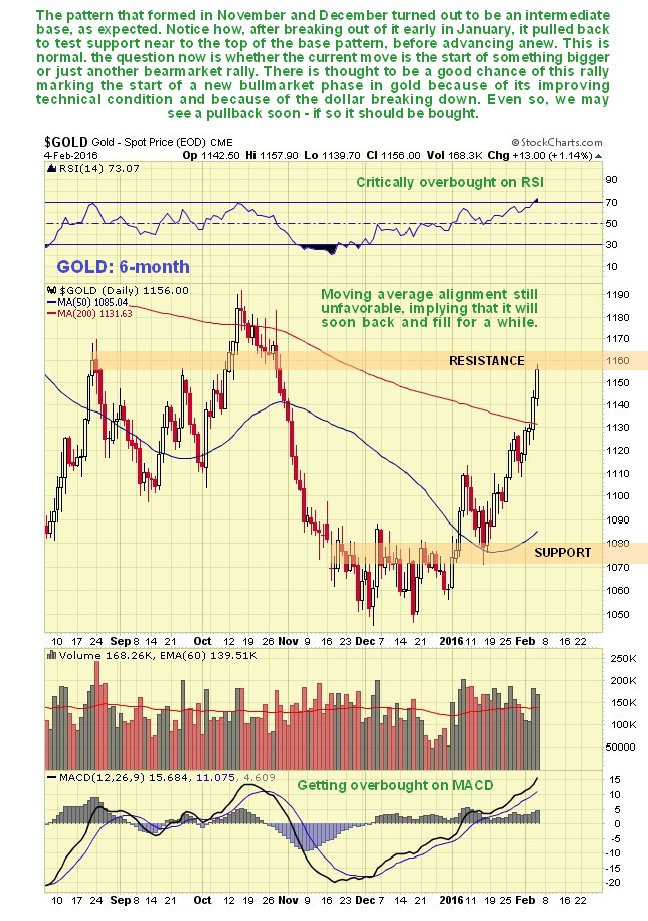
Now we proceed to look at the latest charts. On the 6-month gold chart we see that it has made good gains over the past couple of weeks, and the big question to address here is whether it is going to get whacked back down again, as has always happened up to now in the recent past, every time it has poked its head out above the parapet. Considering how hard the dollar has dropped over the past couple of days, the rise is not very impressive, and since it has risen up through a still falling 200-day moving average to a point way above its 50-day to arrive at a resistance level at the upper boundary of the major downtrend channel shown on its 5-year chart below, the chances of a pullback soon are considered to be high. However, don’t forget the mounting bullish factors described above that are starting to come into play. If may not drop back far, if at all, and it could surprise by breaking out of the downtrend channel, which would trigger a much more dramatic rally.
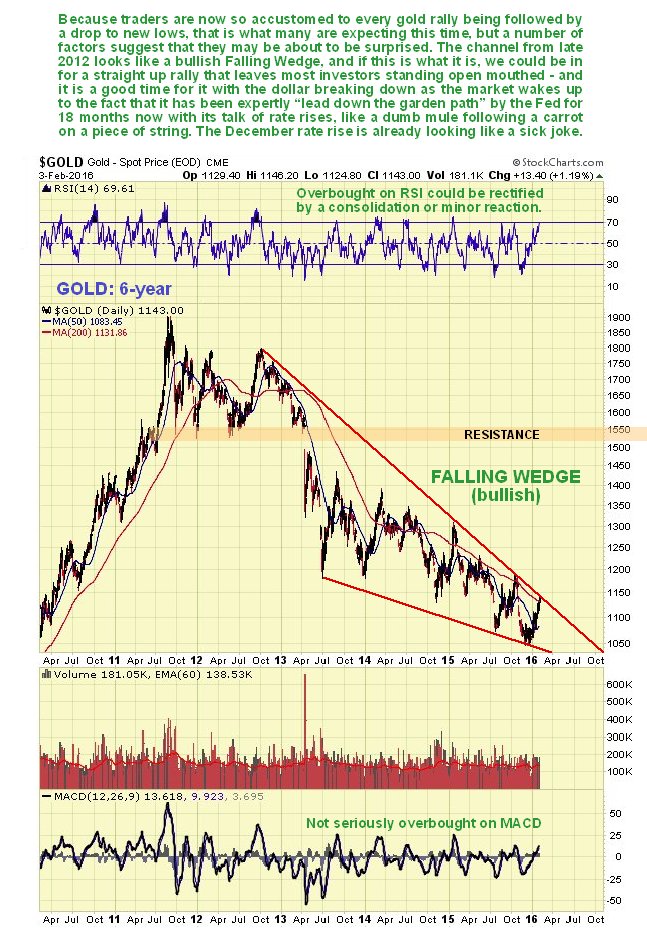
On the 5-year chart for gold we can see that while there is scope for a minor pullback here or soon, overall the chart looks positive with a strongly converging and thus strongly bullish Falling Wedge now closing up, and it is not seriously overbought on its MACD on this chart. If it does break out upside we could see a meltup that leaves most traders standing mouth agape, although the still unfavorably aligned moving averages suggest that it might take a little more time before the conditions for this sort of move to occur are ripe. We should aware of the possibility however, and use any short-term pullback to aggressively build positions – you know, like the Chinese have done for years now.
GDX is still stuck in its downtrend with still unfavorably aligned moving averages. We saw the sharp rally of recent weeks coming and took advantage of it, using vehicles like NUGT, but now as it is arriving at resistance near to its falling 200-day moving average and the upper boundary of its major downtrend, we should watch out for a pullback. A breakout above the trendline and the resistance level immediately above it will obviously be an important bullish development…

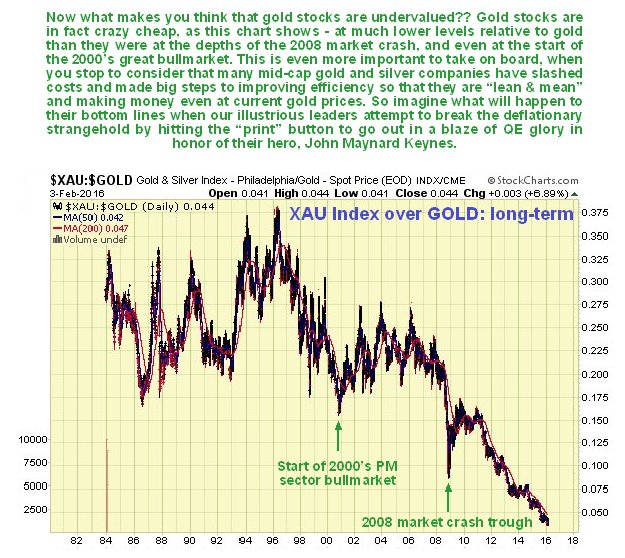
Gold stocks are amazingly undervalued relative to gold itself, more so than they have ever been, and so are viewed generally as an excellent value investment, especially as many gold mining companies have slashed costs and become “lean and mean” so that they are profitable even at current gold prices…
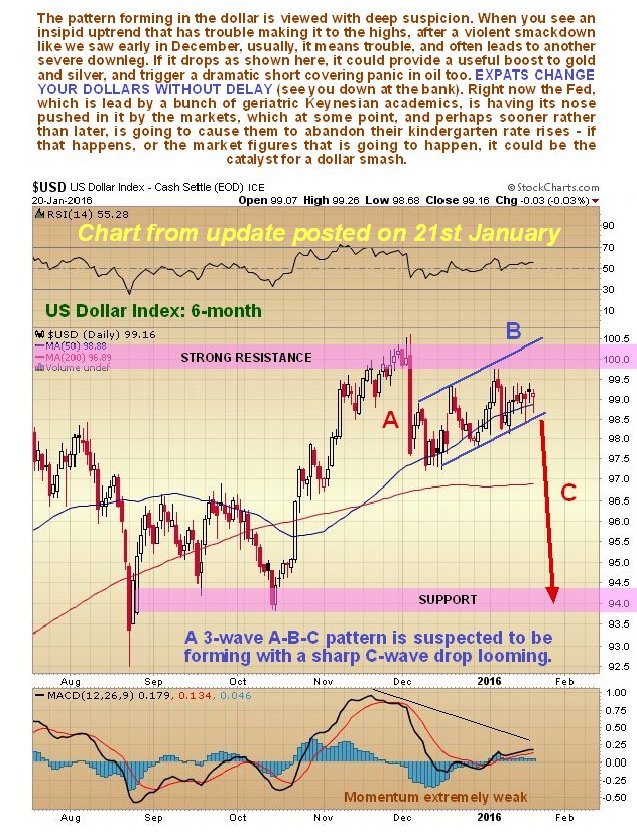
The dollar has caved in. This was predicted on the site on 21st January…
And here is what happened…
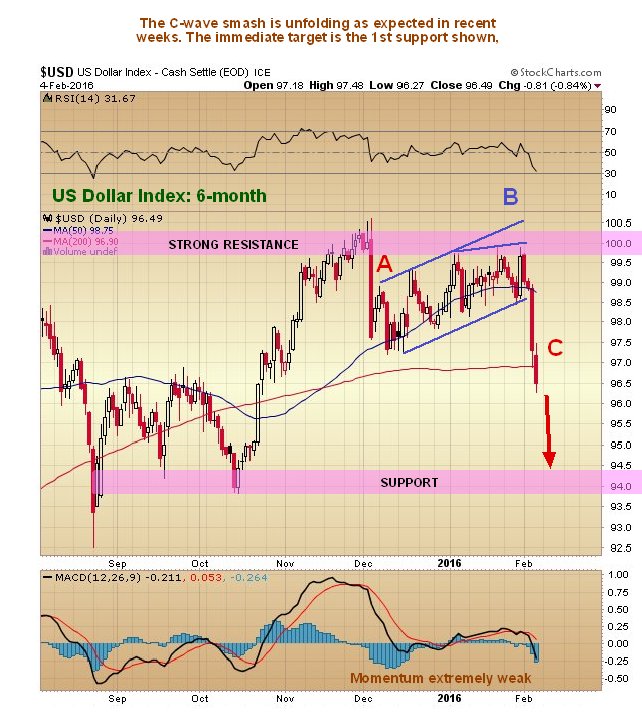
It now seems likely that the dollar will continue to drop to arrive at an initial downside target in the 93 – 94 area. This implies more immediate upside for gold, so it may break out of its major uptrend before this move is done, and then have a pullback towards the breakout point, at which point we will of course “back up the truck”.
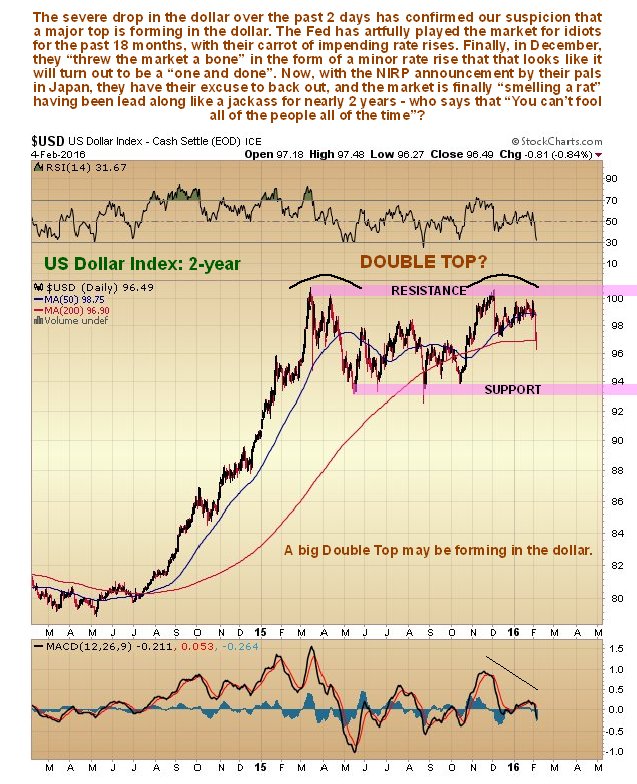
On its 2-year chart we can see that the dollar has now failed at its highs, which is bearish, and it now looks like a large Double Top is completing, as we had earlier suspected. The support in the 93 – 94 area, at the lower boundary of the suspected top pattern, which it looks like it headed towards, should prop it up for a while at least.
Gold’s latest COTs show that, while Commercial short positions are building, they are still quite some way from reaching levels that would be construed as being bearish. So there is scope on this for further gains.
Click on chart to pop up a larger, clearer version.
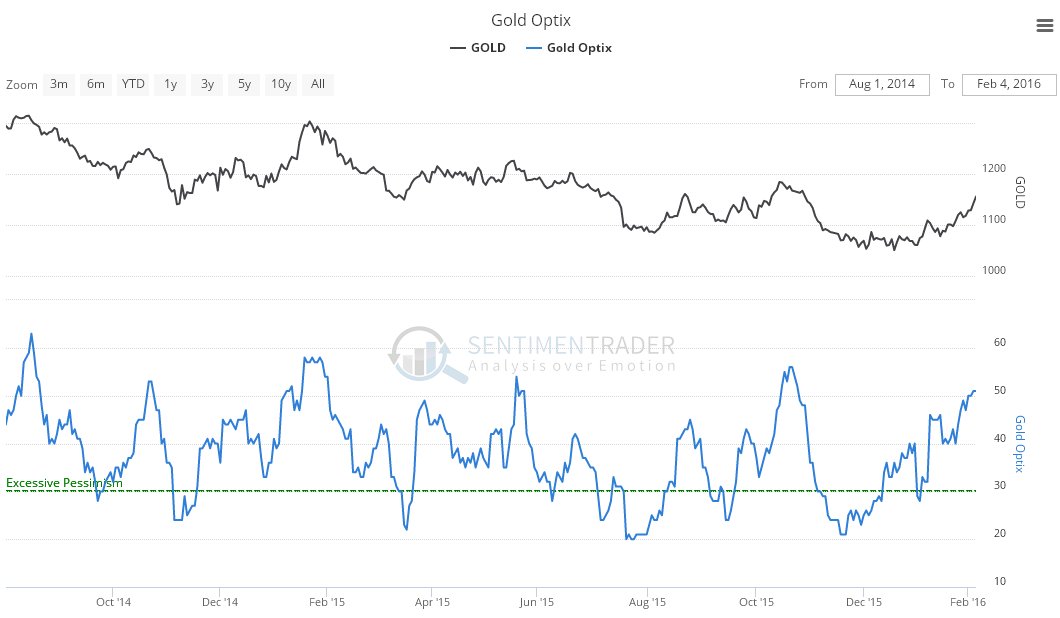
Gold’s latest optix (optimism) chart on the other hand is rising to levels that suggest a pullback before much longer, perhaps after a breakout first…
Click on chart to pop up a larger, clearer version. Chart courtesy of www.sentimentrader.com
Finally, the gravity of the gathering deflationary implosion is made plain by the shocking chart for the Baltic Dry shipping index. This chart alone implies that they are going to do something dramatic soon in an effort to alleviate the situation, such as a monster global QE program…

Conclusion: the outlook for gold is brightening rapidly. Many observers are expecting it to do now what it has always done in recent years, when it has risen up to challenge its falling moving averages near to the top of its major downtrend channel, which is to do an about face and drop back down again, probably to new lows. This time however there is good chance that it will break out of its downtrend and possibly go into “melt up” mode, along with silver and Precious Metals stocks – especially PM stocks, which are horribly undervalued. Fundamentally, it is not hard to see why this should be the case. The dollar’s serious breakdown this week, which results from the NIRP move in Japan, and the market’s realization that this makes further rate rises in US much less likely, coupled with now rapidly growing pressure for concerted global QE to beat back the mounting forces of deflation, which are threatening to cause a wave of major defaults and a credit crisis, mean that massive and widespread inflation is not far over the horizon. While this is obviously not good news for the average housewife, what could be better for gold?
Originally Published February 6th, 2016.
Reprinted with permission from CliveMaund.com.
The post Why You Should Care About the Baltic Dry Index appeared first on LewRockwell.

Leave a Reply